Y10 Econ Week 2
Final PPF Stuff
This week, we spent some extra time on PPF graphs. I am now confident that most of you understand what a PPF represents (opportunity cost) and the ways that a PPF can shift. On Friday, I tried to be sure that all students have everything a PPF question might include in their notes. For anyone I missed, I give you this here.
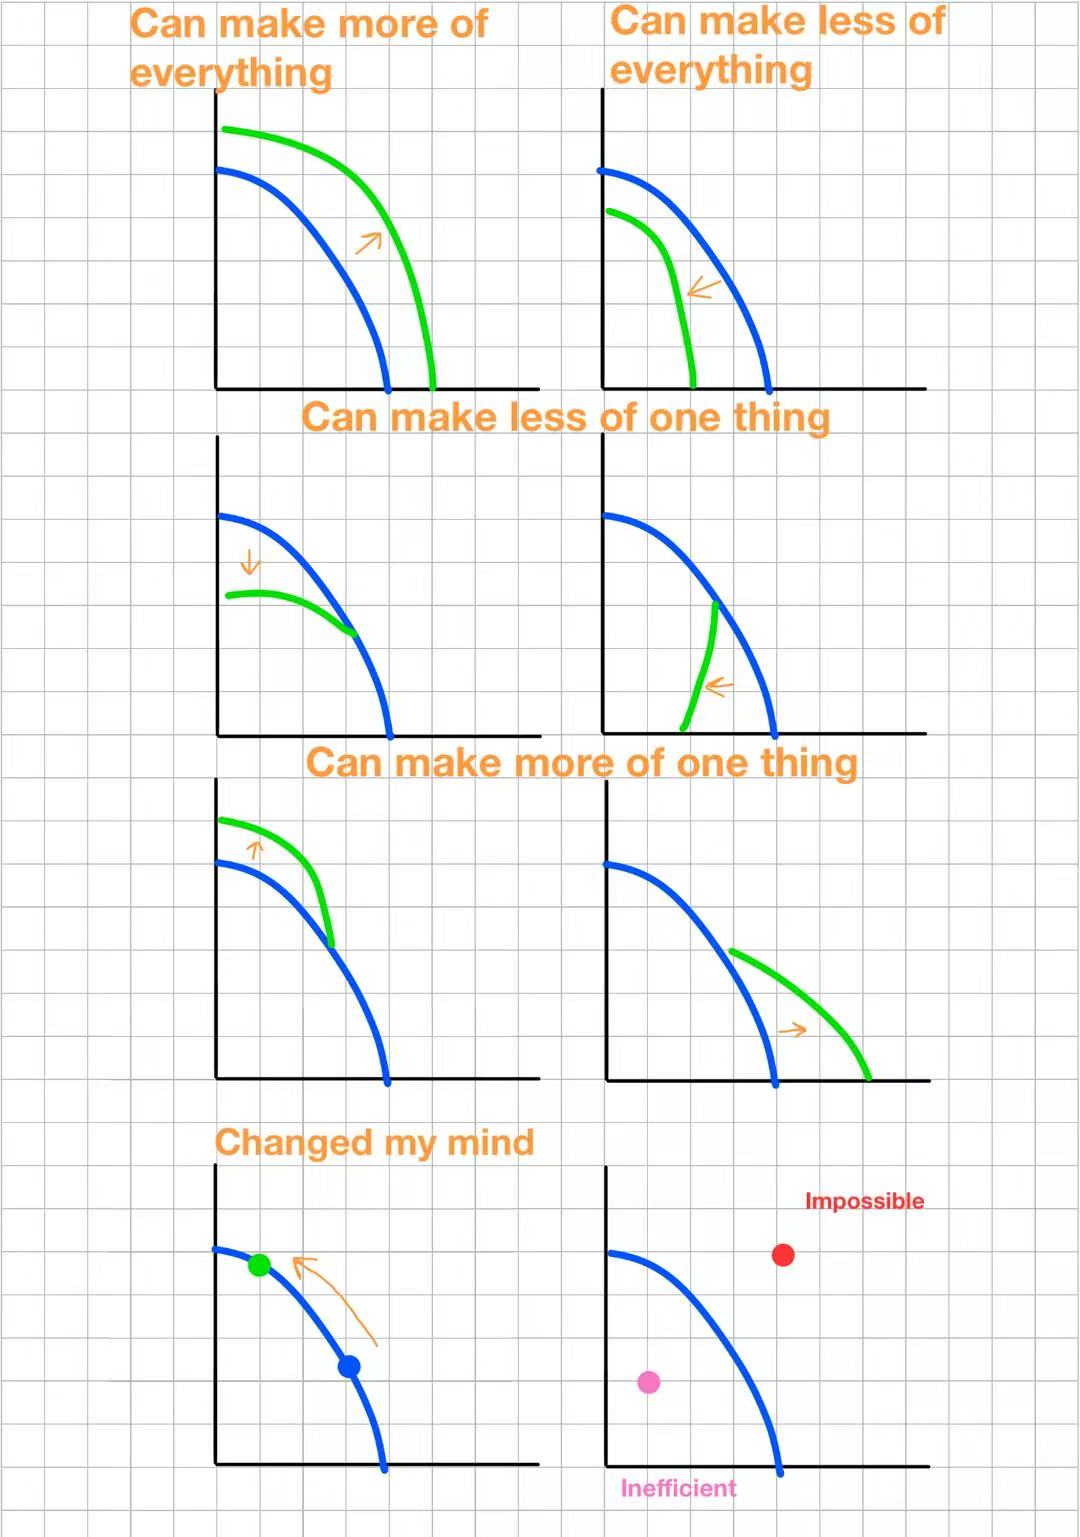
Production Possibility Frontier Possibilities
Sometimes the graph says “Capital Goods” and “Consumer Goods”
When the PPF says Capital Goods and Consumer Goods for the opportunity cost, the question will probably be something like “How will the graph change if a country chooses more capital goods than consumer goods?” The answer to that is the first graph above: “Can make more of everything.” More capital goods shift the whole PPF right. As long as a country does not choose to produce 0 capital goods, the PPF will shift right. If there is a natural disaster or something else that makes production go down for everything, the PPF will shift left.
Comparative Advantage
We started talking about comparative advantage. There is another post about that.